The Power of Moving Averages: Simplifying Trend Analysis
Introduction
In the world of technical analysis, moving averages stand as some of the most widely used and versatile tools. They offer traders a way to smooth out price fluctuations, identify trends, and generate trading signals. Whether you’re a novice trader or a seasoned professional, understanding how to use moving averages can significantly enhance your ability to analyze market trends and make informed trading decisions.
What are Moving Averages?
- A moving average (MA) is a technical indicator that calculates the average price of a security over a specified period.
- As time progresses, the MA continuously updates, creating a smooth line that filters out short-term price fluctuations (“noise”).
- By visualizing the average price over time, moving averages reveal the overall direction of the market trend.
Types of Moving Averages
-
Simple Moving Average (SMA):
- The SMA is the most basic type, calculated by adding up the closing prices of a security over a specific period and then dividing by the total number of periods.
- It gives equal weight to all prices in the calculation.
-
Exponential Moving Average (EMA):
- The EMA places greater emphasis on recent price data, making it more responsive to new information and price changes than the SMA.
- It’s a popular choice for traders seeking faster reactions to market trends.
How to Use Moving Averages for Trend Analysis
-
Trend Identification
- Uptrend: When the price of a security consistently stays above a moving average (especially longer-term MAs), it suggests an uptrend.
- Downtrend: When the price remains below a moving average, it indicates a downtrend.
- Trend Changes: A price crossing above a moving average can signal a potential trend change from bearish to bullish, and vice versa.
-
Support and Resistance
- Moving averages often act as dynamic support and resistance levels.
- Support: In an uptrend, prices might bounce off a moving average, finding temporary support.
- Resistance: In a downtrend, prices might struggle to break above a moving average, facing resistance.
-
Crossovers for Trading Signals
- Bullish Signal: A shorter-term MA crossing above a longer-term MA is called a “golden cross,” often interpreted as a buy signal.
- Bearish Signal: A shorter-term MA crossing below a longer-term MA is known as a “death cross,” potentially indicating a sell signal.
Popular Moving Average Strategies
-
Trend Following: Using moving averages to identify the prevailing market trend and entering trades in its direction (e.g., buying when prices are above the MA in an uptrend).
-
Moving Average Crossover System: Using crossovers of two or more MAs to generate buy and sell signals.
-
Combining MAs with Other Indicators: Moving averages can be used to confirm signals from indicators like RSI, MACD, or Bollinger Bands.
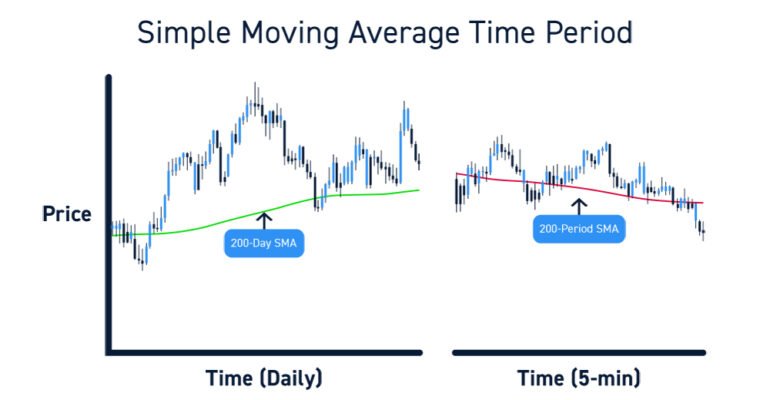
Commonly Used Moving Average Time Periods
- Short-term Traders: 10-period MA, 20-period MA, 50-period MA
- Intermediate-term Traders: 50-period MA, 100-period MA
- Long-term Investors: 100-period MA, 200-period MA
Key Considerations
- Lag: Moving averages are lagging indicators, as they’re based on past prices. Be aware that signals might be delayed.
- False Signals: Crossovers can generate false signals, especially during volatile or sideways markets.
- Combination with Other Tools: Use moving averages in conjunction with other technical indicators and fundamental analysis for stronger signals and confirmation.
Example: Using a 50-Period Moving Average
- Scenario: A stock has been trending upward, and the price is consistently above the 50-period MA.
- Interpretation: This suggests a bullish trend. A trader might use the 50-period MA as an area to consider placing buy orders.
- Exit Signal: If the price falls below the 50-period MA, it could signal a potential trend weakening, prompting a trader to consider exiting the long position.
Conclusion
Moving averages offer a powerful way to simplify price action and identify market trends. By understanding their calculation, types, and how to interpret their signals, traders can enhance their decision-making process. While valuable, it’s essential to remember that moving averages are just one tool in a trader’s arsenal and should be used in conjunction with other analytical techniques for increased confidence.